Scroll

UX Case Study

Trail Sections

Turning municipal trail closures into 3-tap, audio-guided detours.

Published 05/14/26

Trail Sections is a four-week project that helps people find detours during closures of the Lower Don Valley Trail. It takes a broken system of municipal documents and turns it into a mobile website that can get you back on track in three taps, in under twelve seconds.

Summary & introduction

The way we fix urban trails needs fixing

Problem statement

Trail users feel overwhelmed by disorganised and inconsistent information sources — both online and on-site — during the closure. Current solutions fail to balance informational value with usability, detracting from the natural experience.

Objectives

  • Present closure information in a highly scannable way
  • Reduce time on task for finding a detour
  • Maintain a sense of discovery and exploration for newer trail users

The solution at a glance

The project resulted in a prototype that aligns navigation to familiar landmarks and major entry points, and employs audio directions for inclusive, eyes-free navigation that reduces on-trail screen time.

Home screen of the Trail Sections mobile website

Hero section of the home screen of the Trail Sections website.

Data collection & analysis

Building a foundation in data

Research gathered data on the trail closure from government sources and social-media posts to understand the situation, then compiled it into a report to identify trends and gauge user sentiment. Interviews with trail users surfaced how they navigated the closures in practice. Analysis was conducted in Miro and Google Sheets — Miro for open-ended exploration through a flexible, visual interface; Sheets for structured data, visualisation, and insight extraction.

Existing trail entrance signage with no detour information

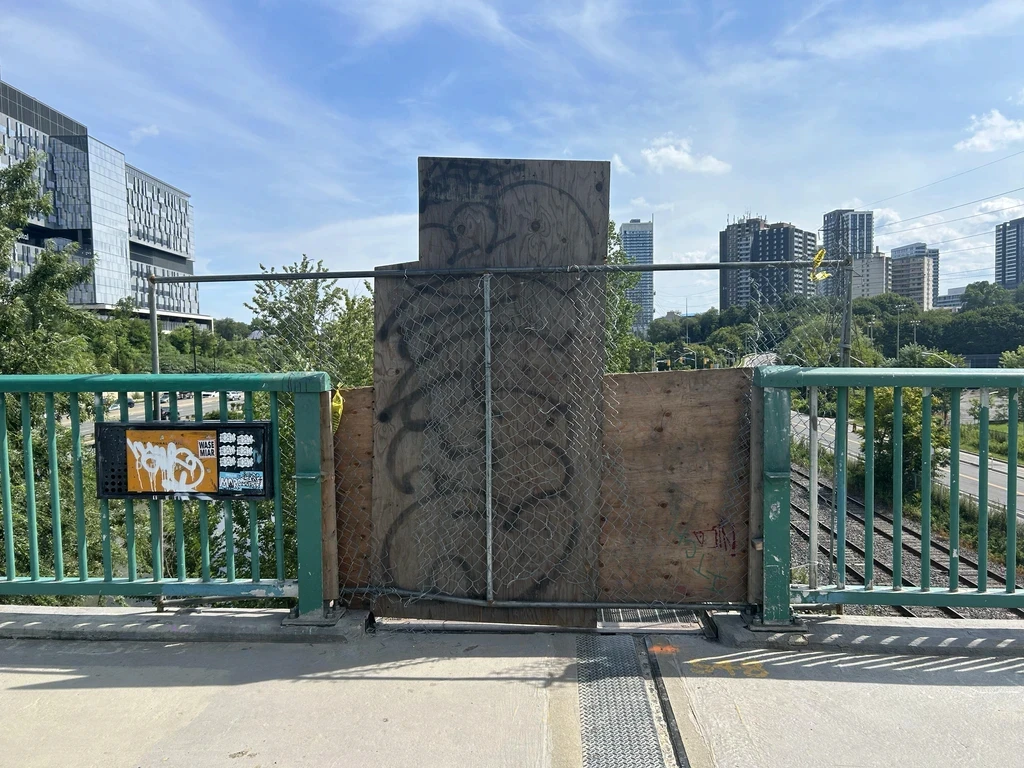
Current state at trail entrances — note the lack of signage and information about detours.

Key takeaways

Lack of usable information at trail-closure sites led to trail abandonment and detour avoidance. Available information did not match user needs and failed to improve the experience. Users preferred high-level information over granular status updates. Their main concerns were: "Where can I access the trail?" and "Is it a paved or a nature trail?"

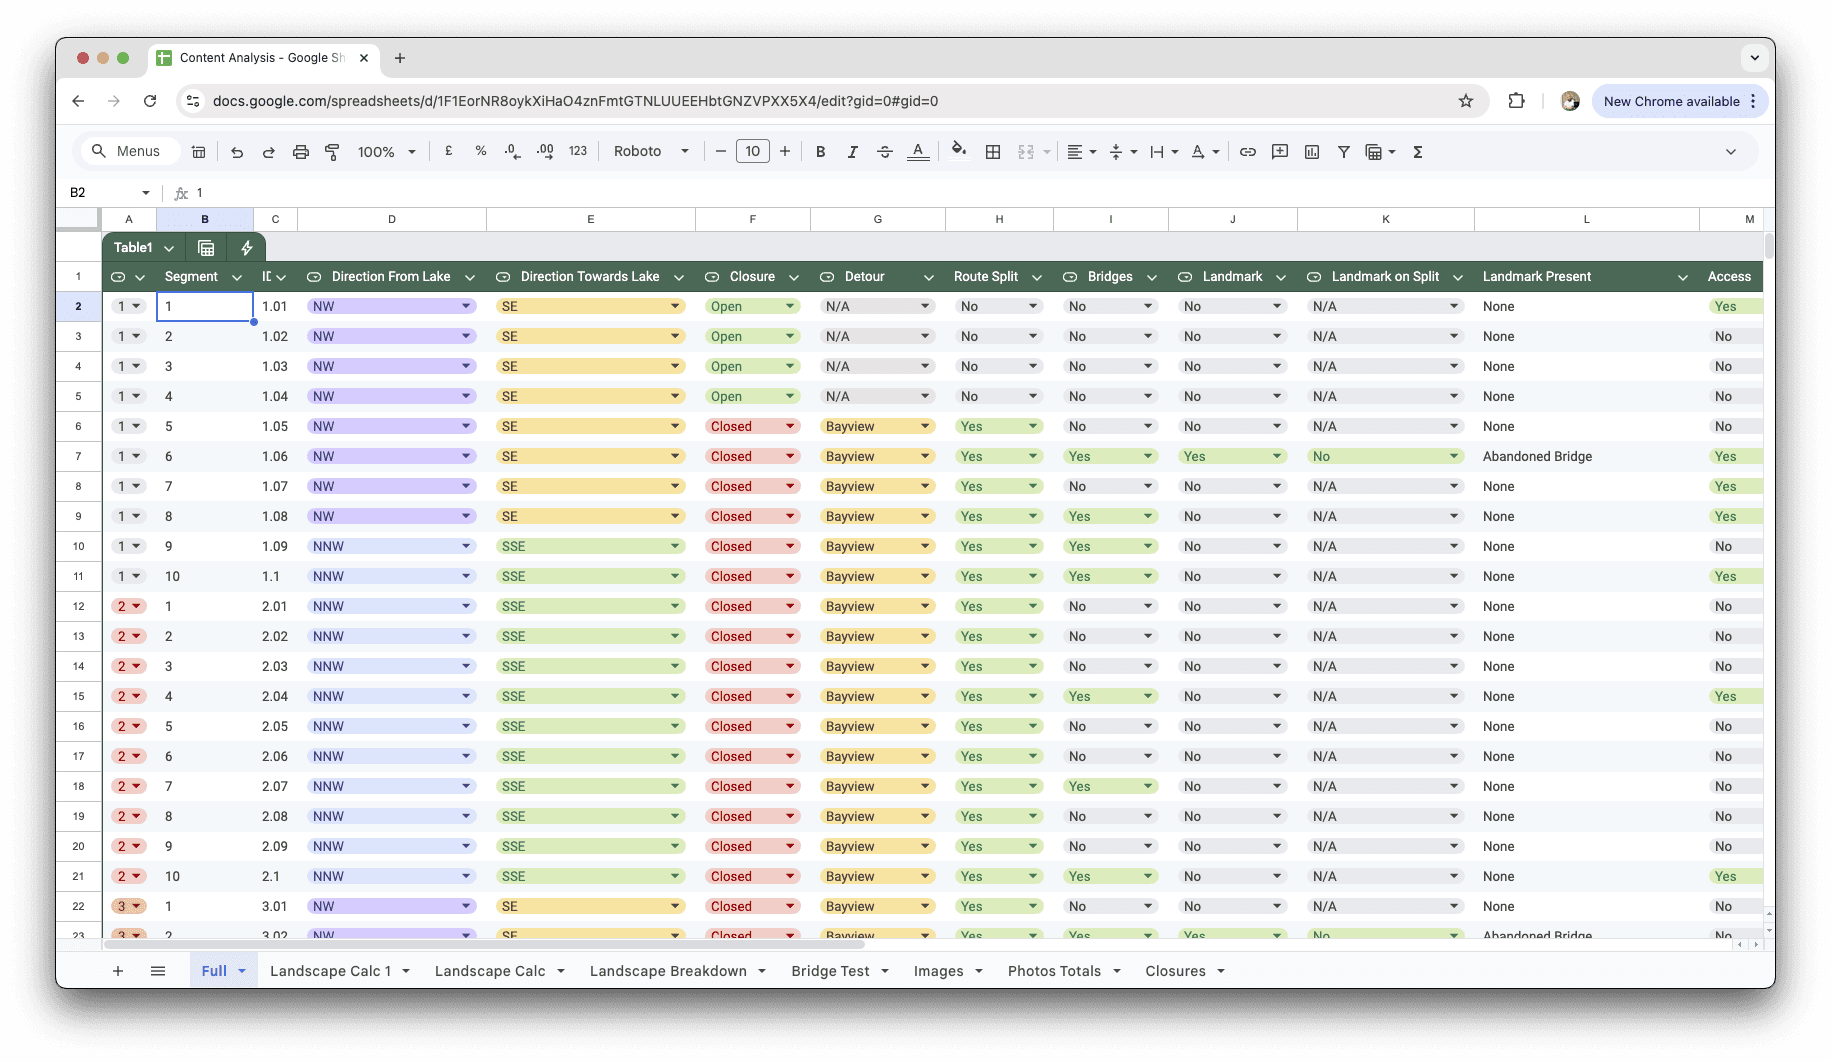
Consolidating the data in Sheets made it possible to analyse detour impact and identify trends. Insights — such as correlations between bridges, user-submitted images, and trail distances — informed how the data should be chunked around users' mental models.

Google Sheets analysis showing correlations between bridges, images, and distances

Google Sheets consolidated the data, surfacing correlations between bridges, user-submitted images, and trail distances. Those patterns informed how content should be chunked around users' mental models.

Bridging navigation gaps

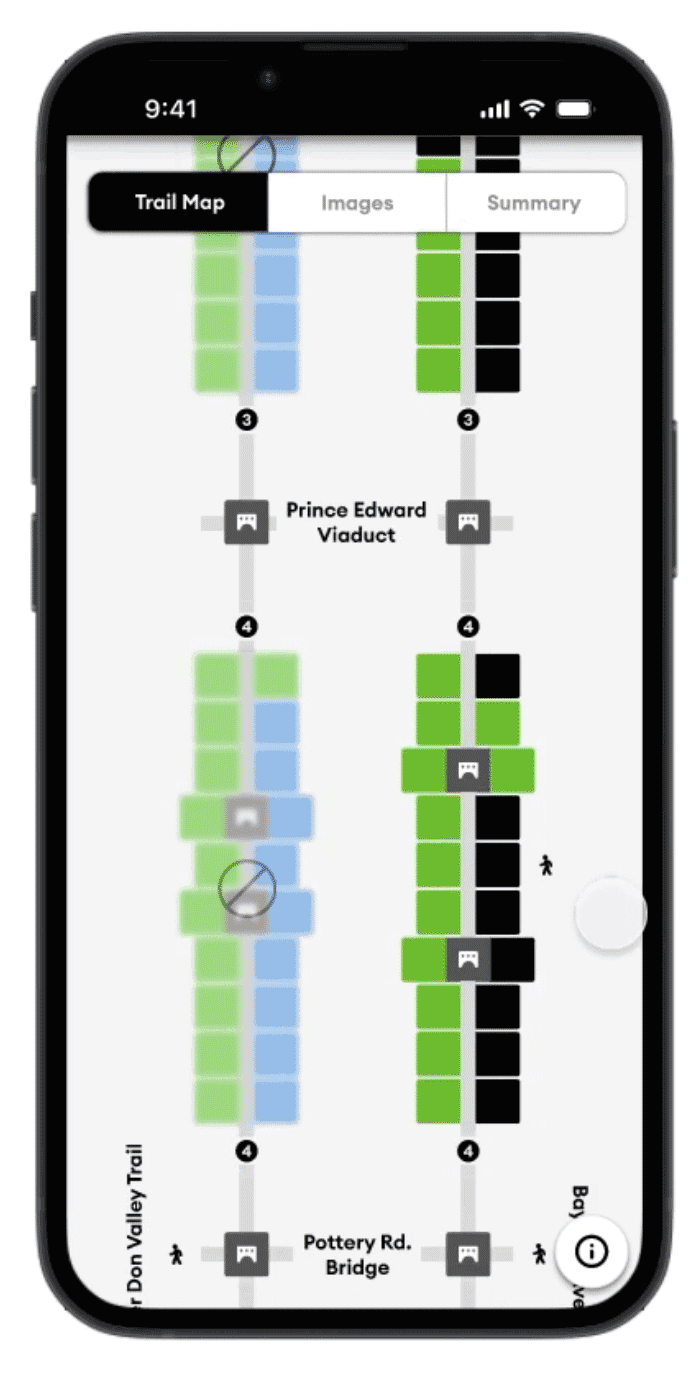
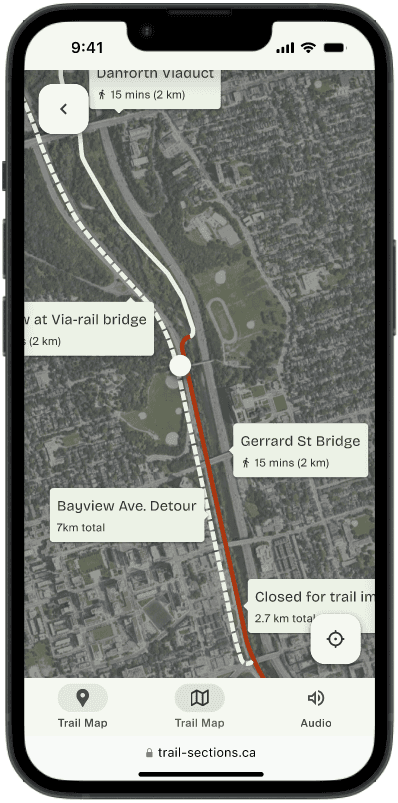
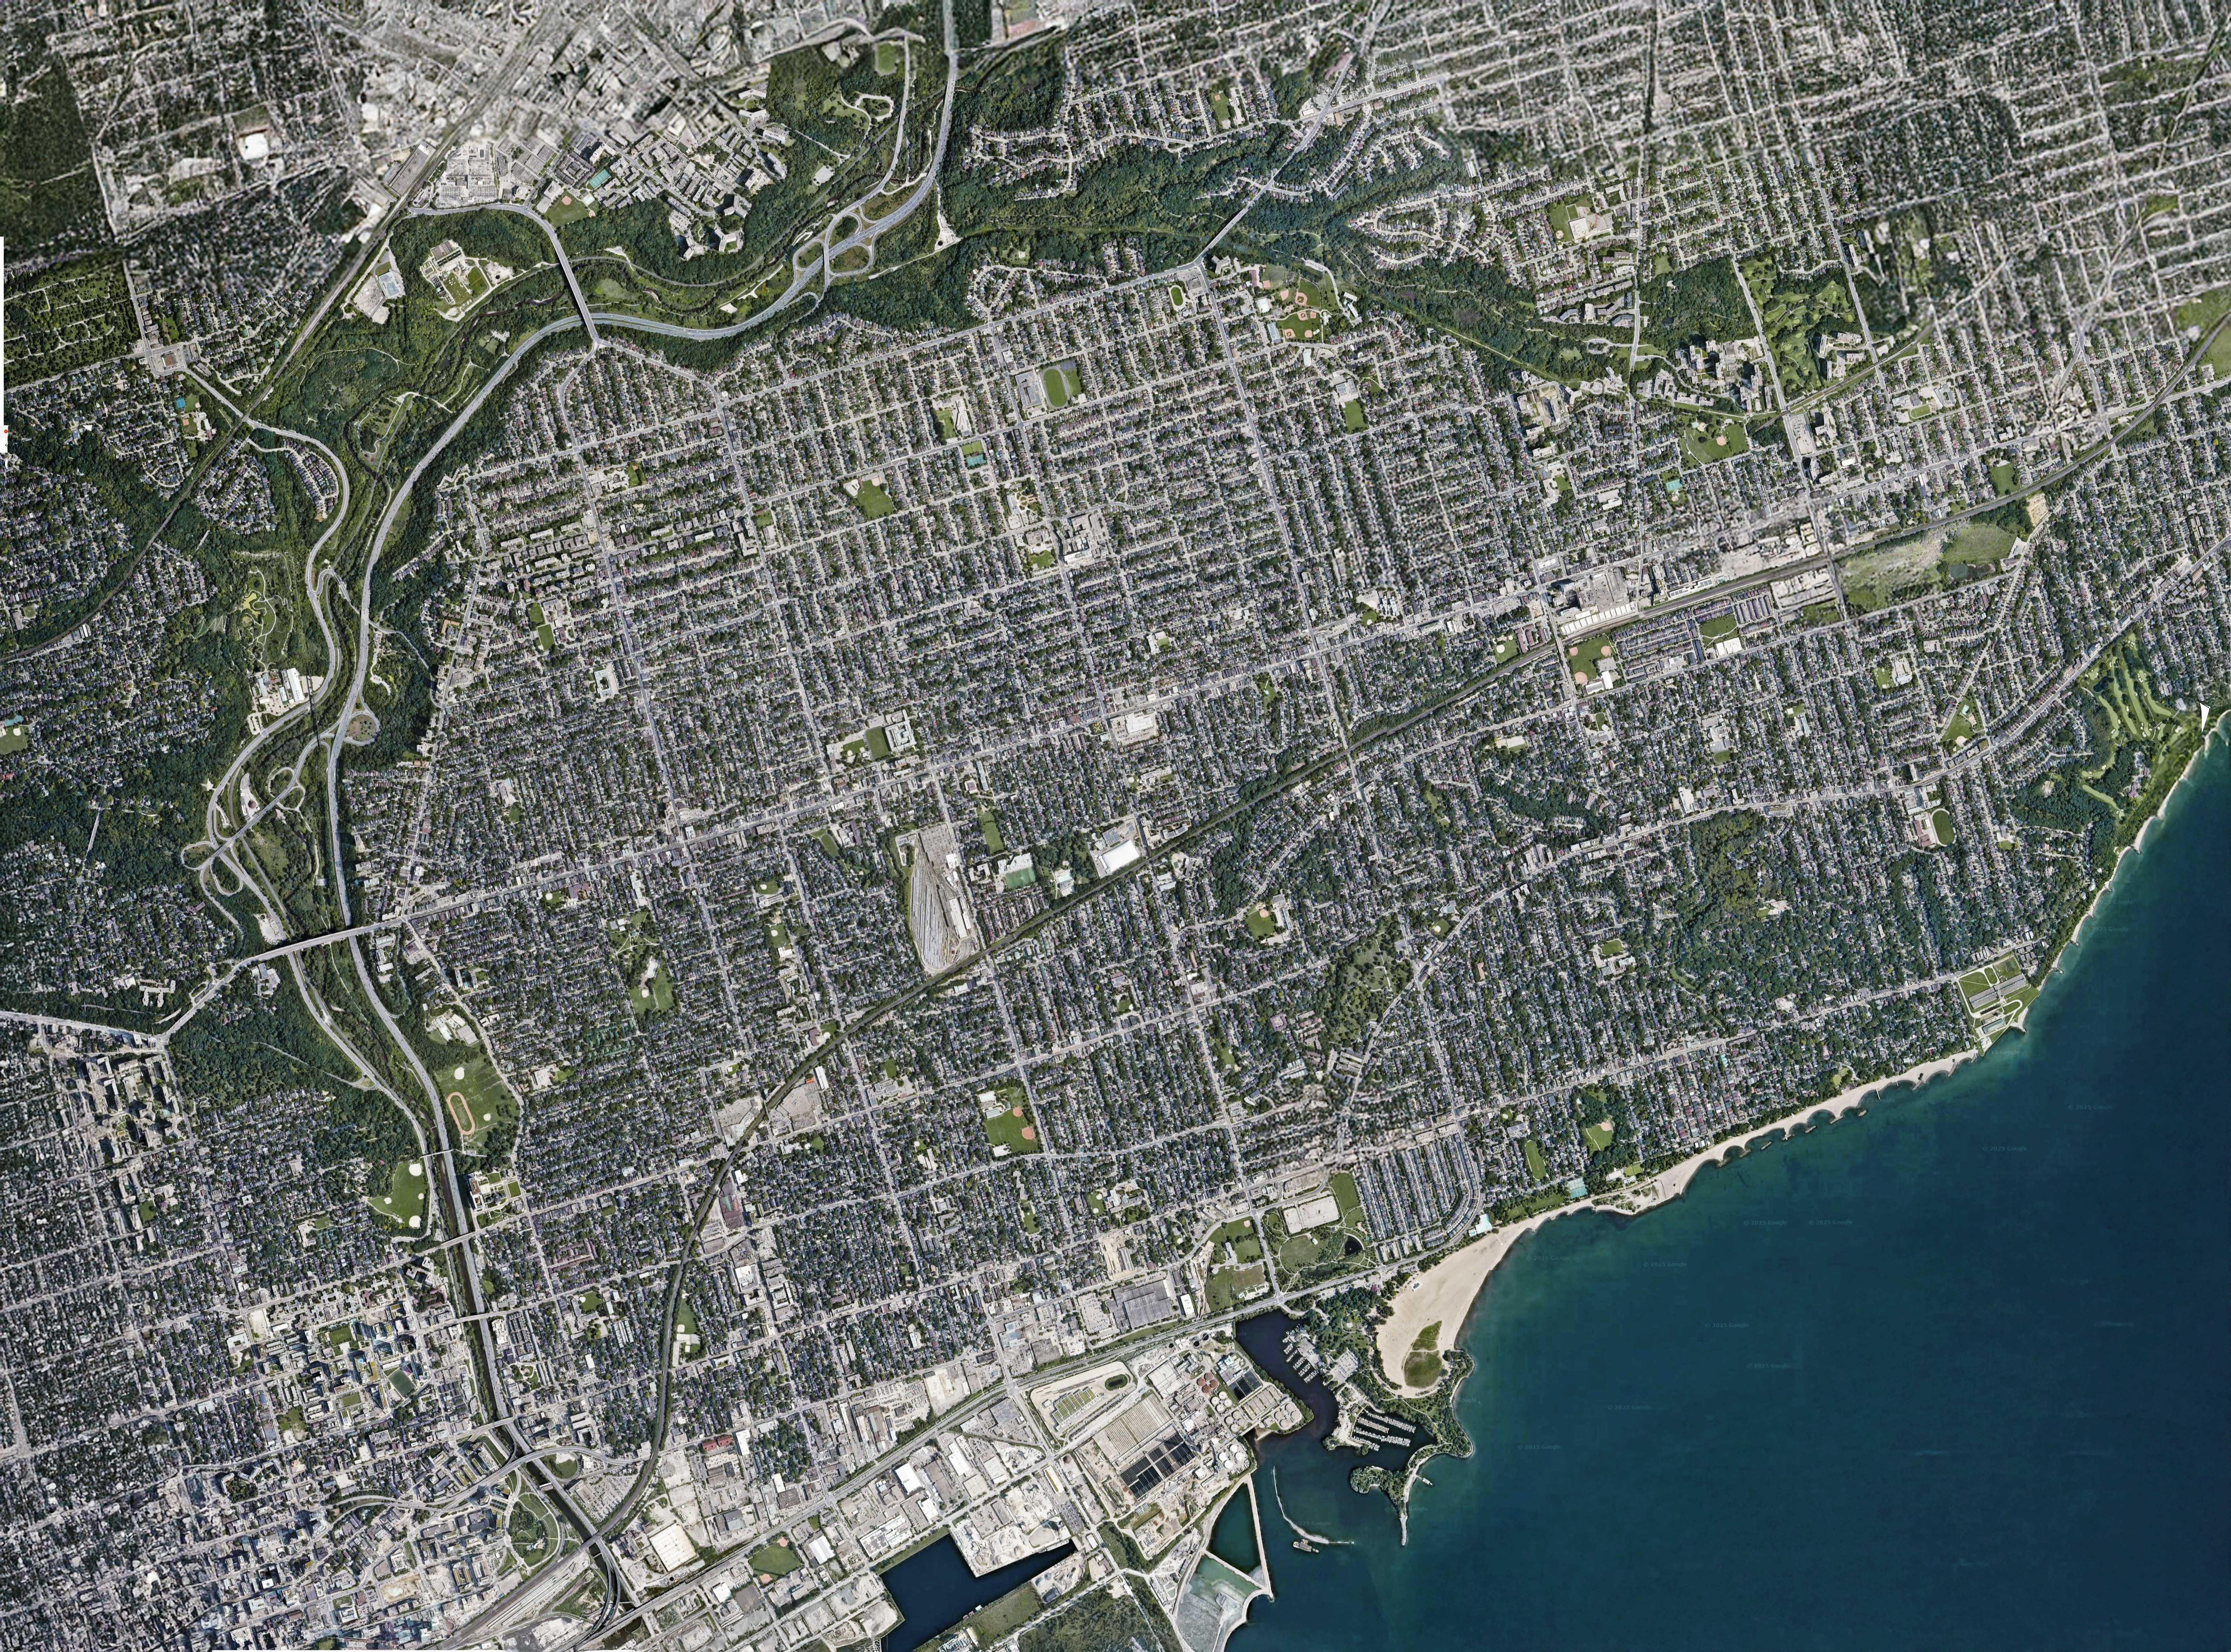
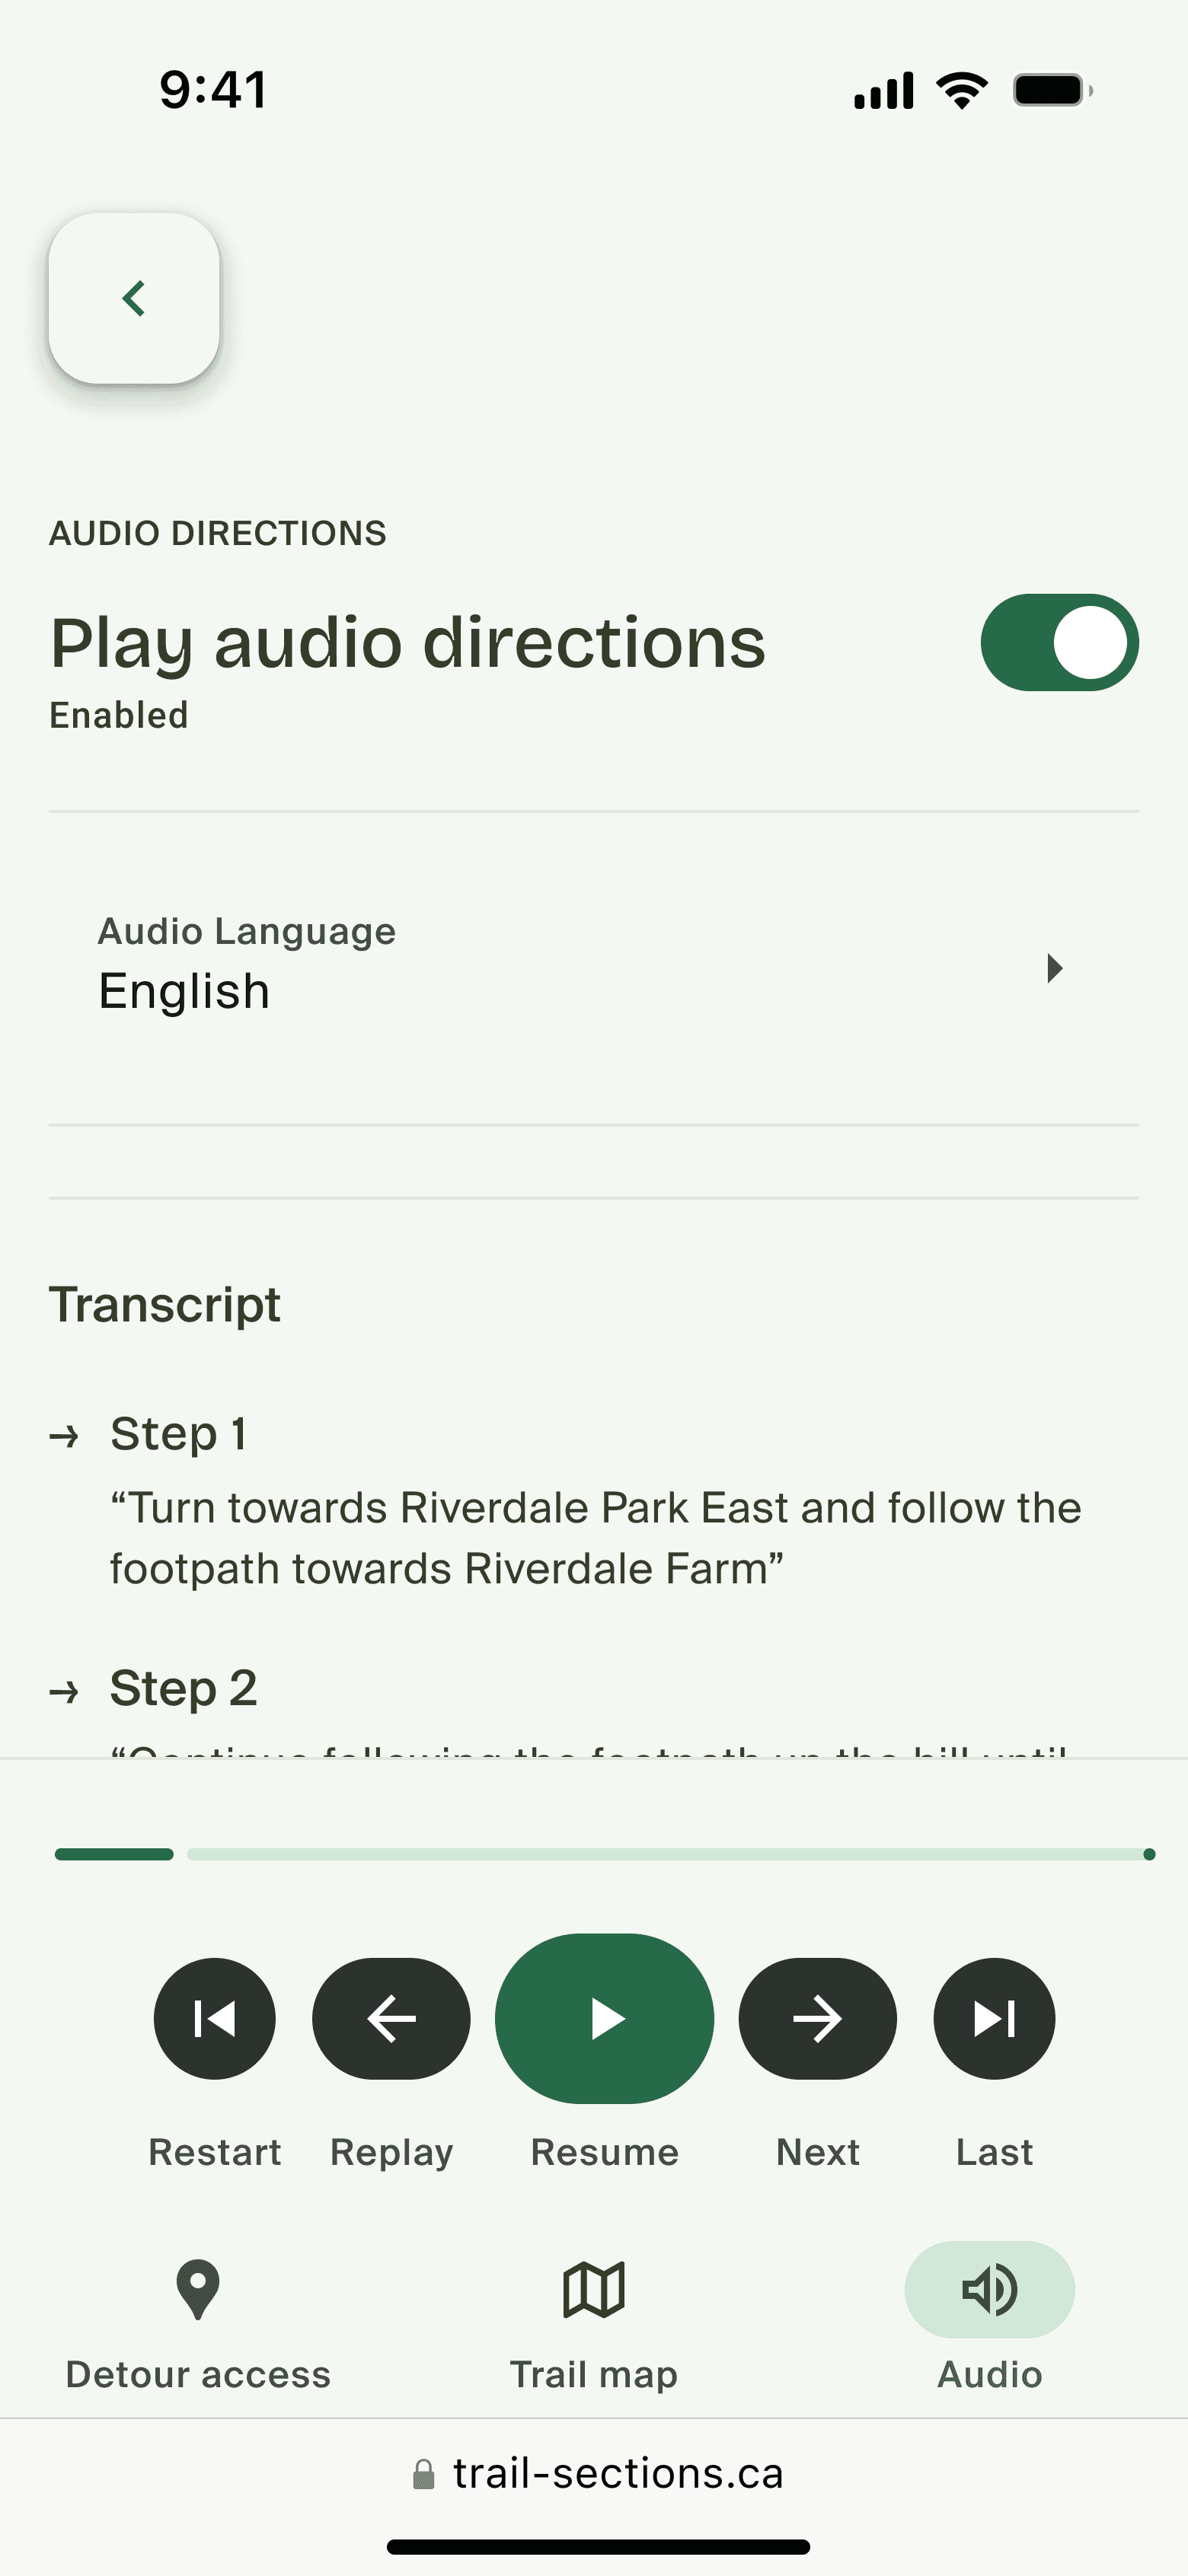
Initial user testing revealed that bridges were the most recognisable landmarks on the trail, leading to a bridge-focused design for the first version of the navigation system. At first, traditional maps were deemed unnecessary due to the trail's linear nature, with users orienting themselves by proximity to the next bridge. Subsequent testing showed this approach was insufficient for finding trail entry points and detours, leading to a quick redesign that incorporated traditional map elements — a more holistic solution that served users from the moment they began seeking the trail.

Turning insights into outcomes

From scattered sources to usable flows

Research confirmed that closure information was buried across municipal documents, social posts, and maps. Initial prototypes tested a data-visualisation model with charts showing trail conditions and access points. While this approach worked for experienced users on-trail, it failed newcomers who couldn't locate detours in the first place.

Revisiting the first iteration, the flows were rebuilt to start with finding a detour before bringing the user to the trail map, and the diagram was replaced with a satellite image map to communicate trail makeup. This served new users better and removed accessibility issues created by the initial version, where colour was used to communicate information exclusively.

Original prototype with chart-based trail breakdown

Original. The first prototype helped frequent trail users, but testing revealed gaps: detours were hard to find from a closed entry point, and colour-only communication limited accessibility.

Updated prototype with satellite map and detour-first flow

Updated. The new flow starts with finding a detour, then drops users into a satellite map view. Clear labels improved comprehension for new users while removing accessibility barriers; MDS components sped up prototyping.

A more holistic solution

12 sec Median time from home screen to actionable detour directions.
3 taps Down from 10+ screens across two municipal sites.
1 site Centralising closure info, access points, and detours.

More information on testing and outcomes can be provided upon request.

Design refinements

Better meeting the users' needs

When familiarity is better than novelty

Initial testing revealed that the first iteration's novel data-visualisation approach was, in real-world use, less effective than a traditional map. Users preferred a general overview of green space between bridges over the detailed breakdown the new chart provided.

The Lower Don Valley Trail, composited from Google Maps

An unannotated map of the trail, composited from Google Maps.

The curb-cut effect in action

Initially scoped as an accessibility feature for low- and no-vision users, audio proved crucial in achieving the project's broader goal of a screen-free, natural experience. Inspired by Strava and Google Maps audio updates, the feature enhanced functionality for everyone — aligning more closely with the project's objectives than a screen-bound solution could.

Audio navigation playback controls

Playback controls for the audio navigation feature.

Novel visuals can be powerful for insight, but familiar patterns — maps, concise labels, audio — win for speed and inclusion.

Leveraging MDS & AI for speed

Adapting an existing system rather than building from scratch

To deliver a rapid redesign, Google's Material Design System was customised to translate wireframes into a working UI quickly while ensuring edge states and accessibility needs were covered. The result — a pragmatic, map-first interface with audio guidance — shipped in days, not weeks, without sacrificing usability or inclusivity.

Tokens, components, and state logic were adapted rather than adopted. That freed time to focus on flows, content clarity, and accessibility.

Customised MDS tokens and components used across the prototype

Tokens, components, and state logic were adapted rather than adopted — that freed time to focus on flows, content clarity, and accessibility.

MDS components applied across the Trail Sections prototype screens

The prototype

Finding a detour

The video below shows a user finding the Bayview Avenue detour from the closure at the Riverdale Park Viaduct. It's designed to limit the interactions required and provide enough information to get moving as quickly as possible.

  1. Home
  2. Find a detour
  3. Bayview detour
  4. Directions
  • "Finding a detour" preview animation with an optional skip button
  • Satellite map view under the "Trail Map" portion of the prototype
  • Images for quick recall when displaying detours
  • Transcripts for quick review on the "Audio" screen

Finding the Bayview Avenue detour from the closure at the Riverdale Park Viaduct.

Accessibility considerations

Baked in, not bolted on

Accessibility was scoped from day one. Optional audio directions and reduced screen reliance support low-vision users; non-colour signifiers and clear labels support colour-blind users. Other priorities included scannable copy, WCAG-compliant contrast, and mobility cues.

Future plans involve formal usability testing with low-vision participants, screen-reader analysis, and expanded audio cues for better routing and labelling.

Audio instructions screen with playback controls and transcript

The audio instructions screen, showing playback controls and a transcript for quick review.

Learning & outcomes

Results, reflections & next steps

By the numbers

  • 12-second median time-to-detour from home screen to actionable directions
  • 3 taps to reach a usable detour, down from 10+ screens across two sites
  • 1 site centralising closure info, access points, and detours

What I delivered

  • Research synthesis across municipal notices and social posts; 1:1 user interviews
  • Information architecture, task and flow diagrams, and an interactive Figma prototype
  • Bridge-based sectioning model aligned to major entry points
  • Satellite map UI built from customised MDS components, with design tokens and UI states
  • Audio-direction scripts and a basic voice-guidance prototype

What I'd do next

  • Connect to a live closures feed or lightweight CMS for timely updates
  • Tag map sections with surface, grade, and width to support wheelchair routing and filters
  • Localise copy (EN/FR) and expand to additional Toronto ravine corridors
  • Run formal usability sessions with low-vision participants; quantify time-to-detour at scale

Impact & reflection

The solution is implementation-ready with minor adjustments to Toronto's municipal branding and a simple data pipeline. The project sharpened the ability to pivot quickly, test assumptions, and balance accessibility with real-world usability.